Impact & Results
The Energy Estimator tool was developed in just six weeks, allowing it to be unveiled at Intel Innovation 23'. Its rapid development and effective presentation attracted interest from over 30 companies, demonstrating its immediate impact and value. This year, the tool was expanded into the open-source community through participation in a Green Software Foundation hackathon, showcasing its potential for broad adoption and significant industry influence. Its ability to integrate seamlessly into existing systems without complex setups further underscored its versatility and appeal.
Problem Statement
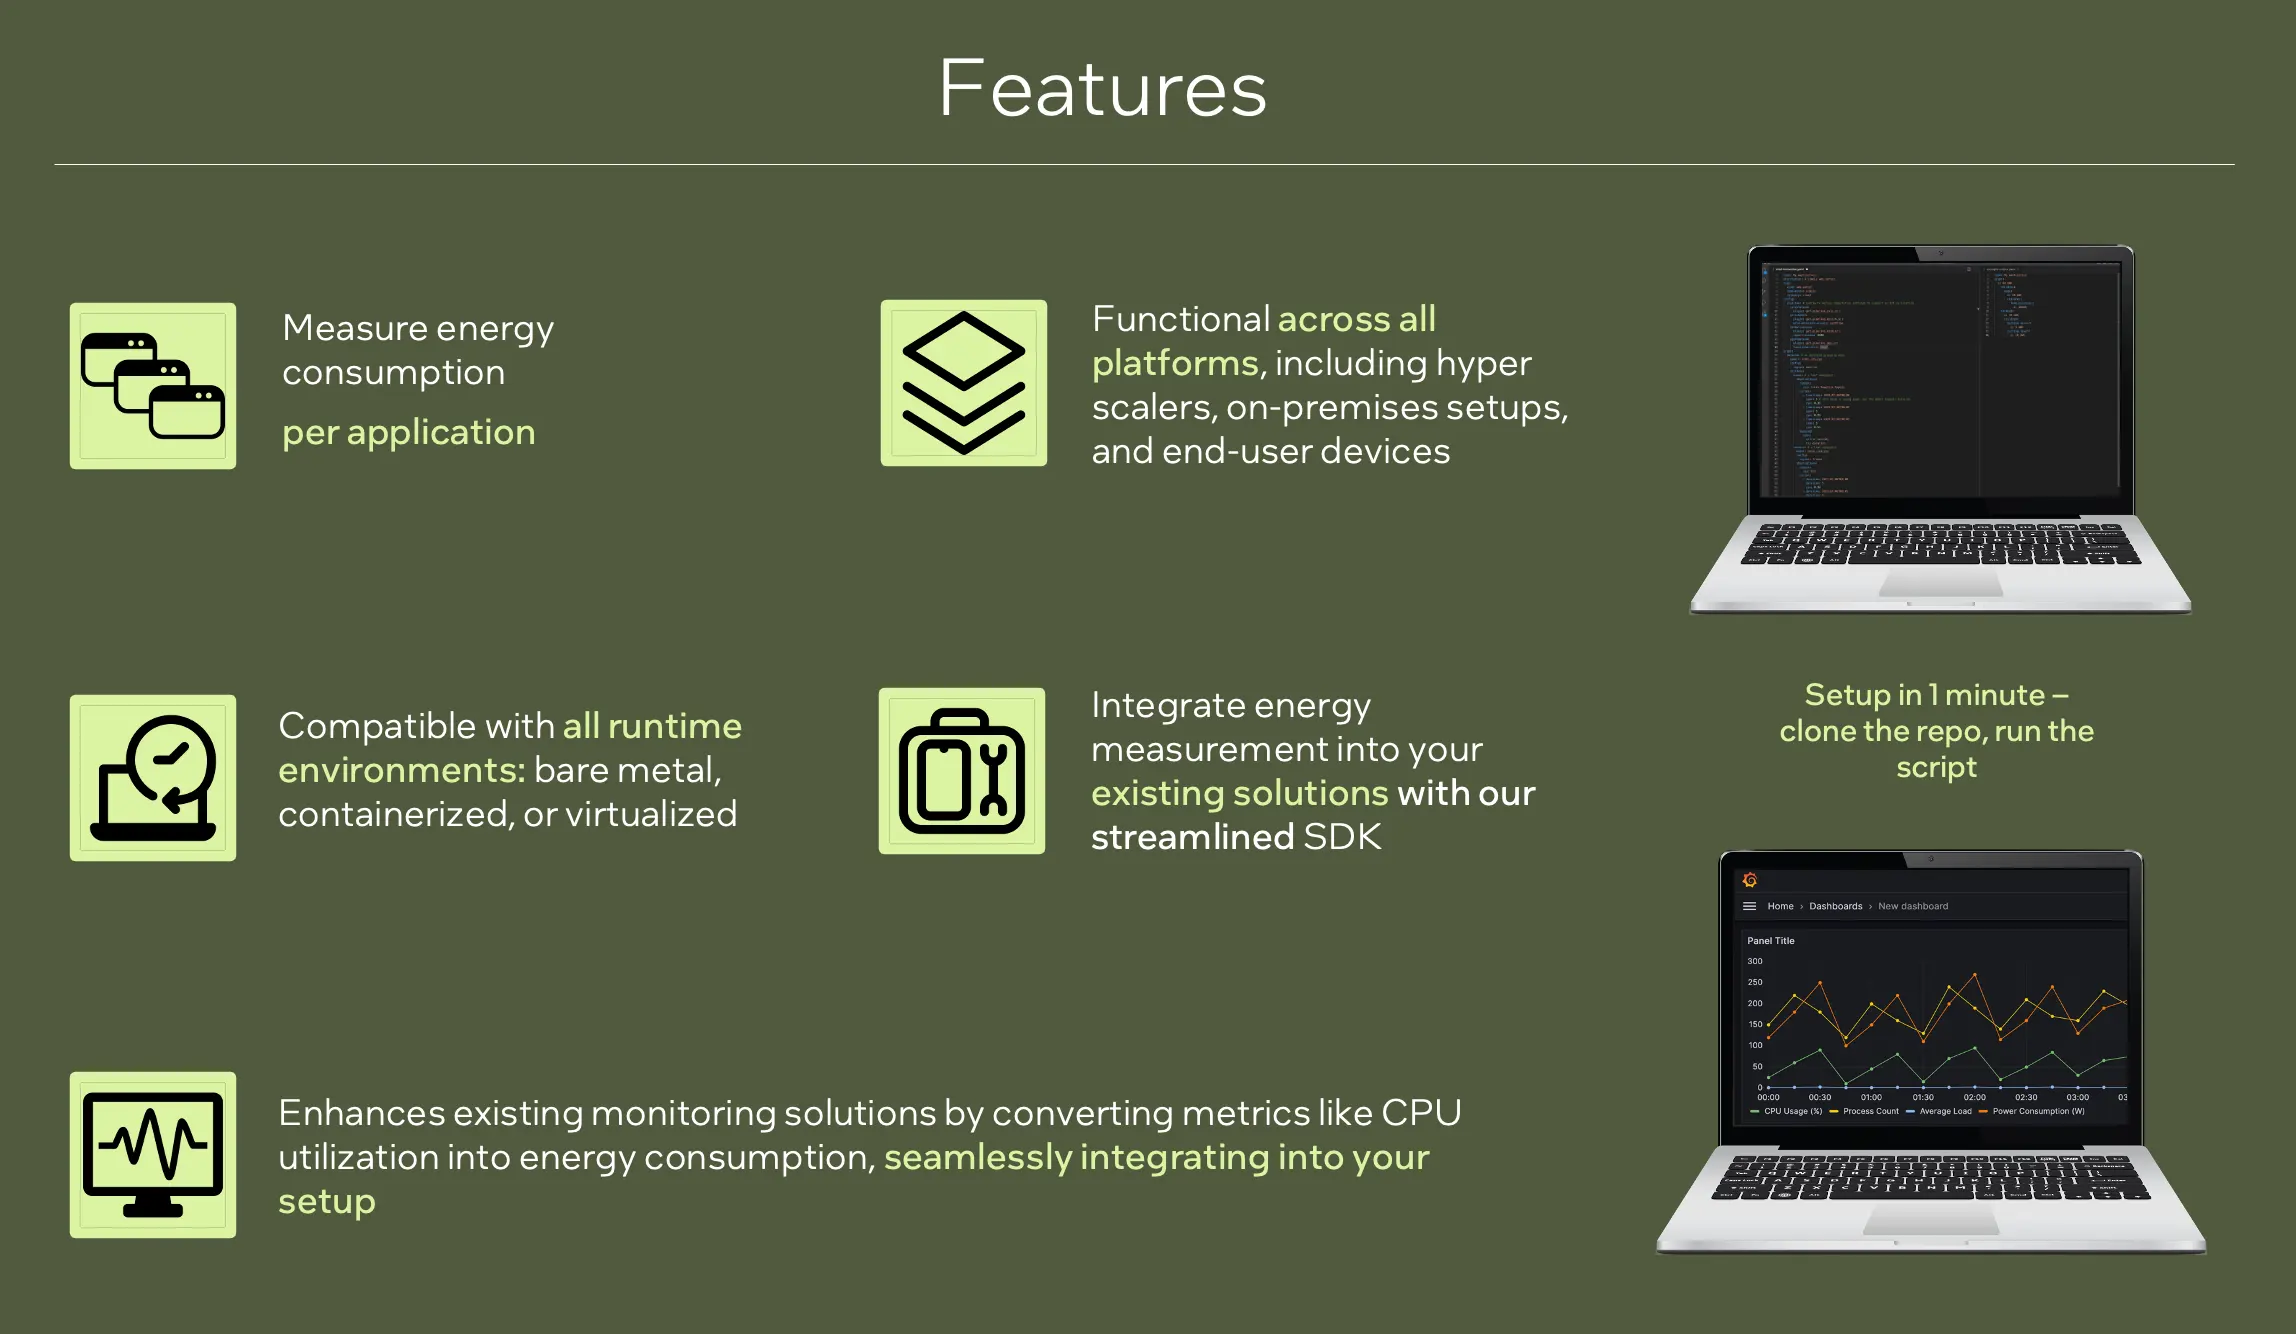
There was a need for a user-friendly tool to estimate the energy consumption of software workloads executed on Intel processors. Existing solutions were often constrained by system-specific requirements and complex setups, limiting their ease of use and integration.
Process & Approach
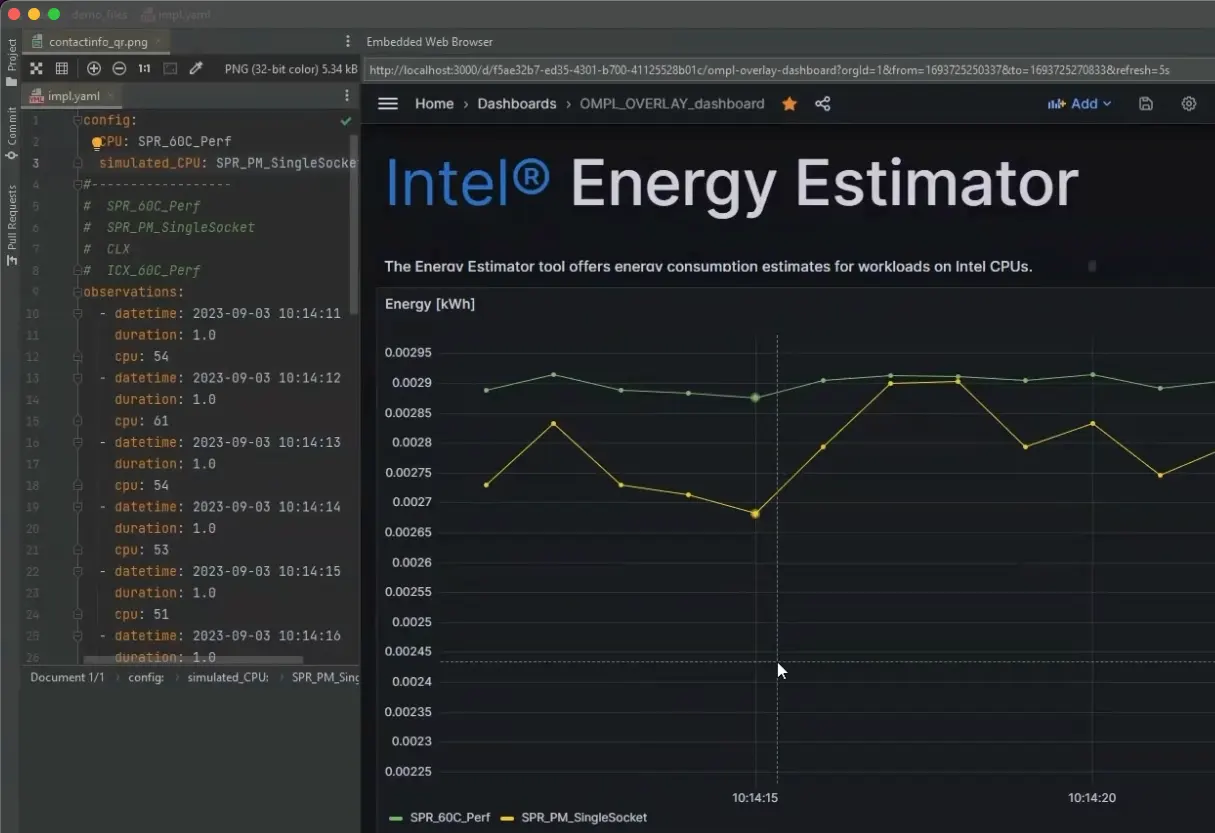
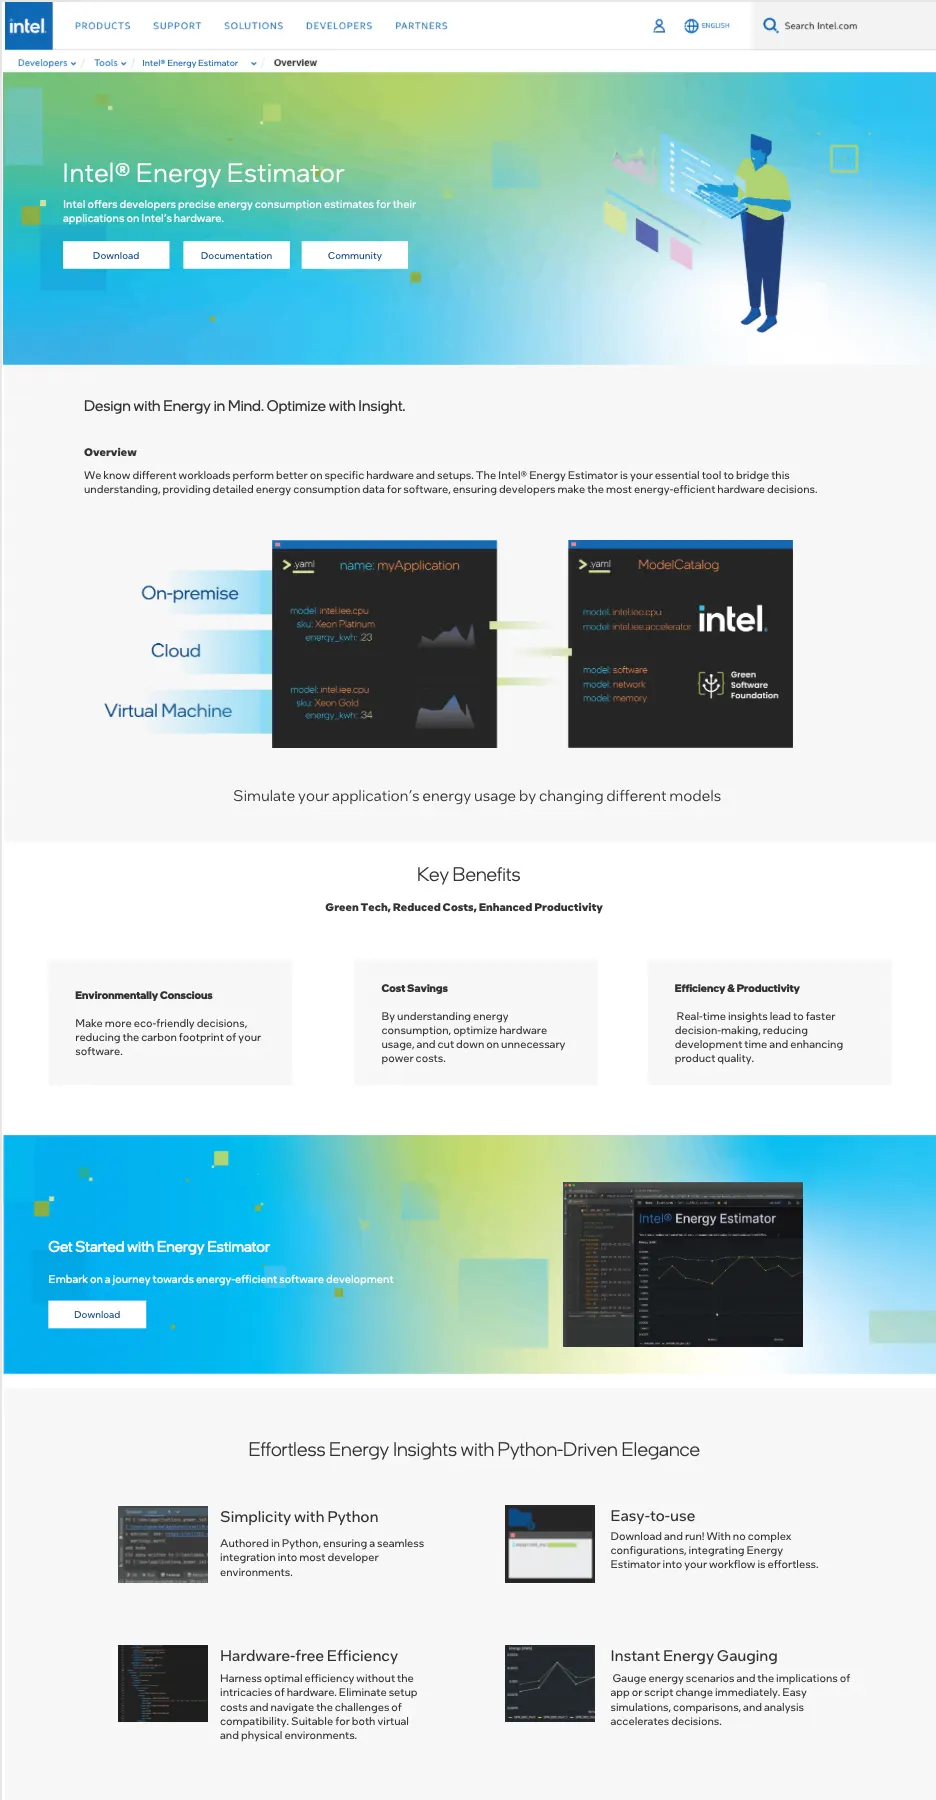
I co-led a team of developers to create the Energy Estimator tool, managing both the development and the visual aspects. I spearheaded the preparation for the demo at Intel Innovation 2023, including the design and creation of the public-facing product page on Intel.com. Additionally, I recommended using Grafana for visualizing data, which was successfully implemented to effectively showcase the tool to customers. This comprehensive approach ensured the tool’s functionality and presentation were optimized for maximum impact and user engagement.
Tools & Methods
PowerPoint
Visual Studio
GitHub
Grafana
Adobe Creative Suite
Axure
ClipChamp
Jira | GitHub
PowerPoint for presentation of concepts to stakeholders
Visual Studio for running tools
Source code housed in GitHub
Grafana used for visualizations
Visual assets created using Adobe creative suite products
Axure for Product page design
Created demo video that ran in booth during conference
Work tracked in Jira & GitHub